The digital divide isn't closing on its own: what the 2025 Australian Digital Inclusion Index means for North Queensland

I’ve spent my career in public education, and a good part of it working alongside families and community members for whom “just get online” was never a simple instruction. In North Queensland, “access to technology” isn’t an abstract policy phrase. It’s the family on a mobile-only plan rationing data before the end of the month. It’s the student who couldn’t submit an assignment because the power was out for three days after a cyclone. It’s the pensioner who wants to do their banking online but has nobody patient enough to show them how.
The 2025 Australian Digital Inclusion Index (ADII) — produced by RMIT, Swinburne and Telstra — puts hard numbers behind what many of us in regional education and community work see every day. The Index measures digital inclusion across three dimensions: Access, Affordability and Digital Ability, scored out of 100. Its 2025 report draws on data collected in 2024 and puts the national score at 73.6.
That timing is worth making explicit: the ADII’s nationally representative data is collected every two years. Project documentation says the 2026 Mapping the Digital Gap survey data will contribute to the 2027 ADII report. An exact publication date for that report had not been announced at the time of writing.
There is real progress in that result. Since the previous wave in 2023, the national Access score rose 4.8 points to 76.8 and Digital Ability rose 8.7 points to 73.6. Affordability sits lower, at 70.3. One caution matters when reading the trend charts: the way Affordability is calculated changed for the 2024 data, so that part of the Index should not be compared directly with earlier years.
But averages hide people. Here are the five things in the data that I think matter most for our region, and what we can actually do about them.
Hero image: algoleague via Unsplash.
1. Your postcode still predicts your digital inclusion
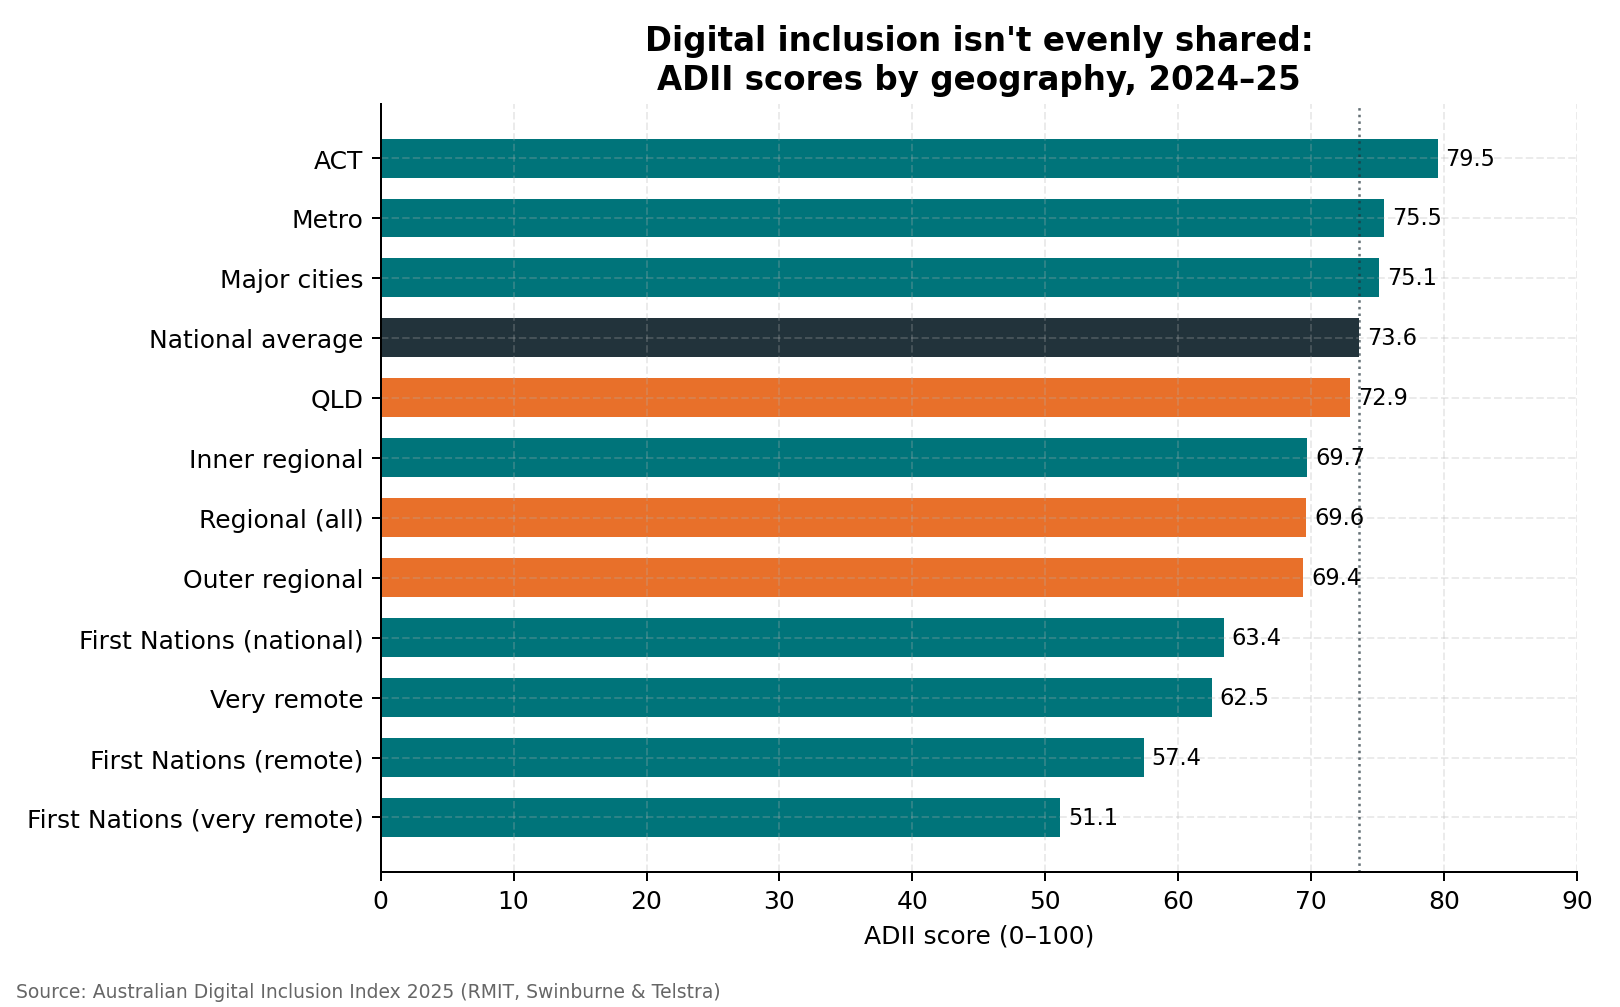
The headline national score of 73.6 papers over a stubborn geographic gradient:
- Metro Australia: 75.5. Regional Australia: 69.6. That is a 5.9-point gap in the latest data.
- Queensland sits at 72.9 — below the national average, and below VIC, NSW and WA.
- Outer regional Australia (which includes much of North Queensland outside Townsville itself) scores 69.4, and very remote Australia falls to 62.5.
- The starkest figure in the whole dataset: First Nations people in very remote areas score just 51.1 — more than 22 points behind the national average. For remote First Nations communities it’s 57.4.
For a region like ours — spanning Townsville, Palm Island, Hughenden, Doomadgee and many smaller communities in between — the “national average” is close to meaningless. Digital inclusion in North Queensland is not one story; it’s a steep slope, and the further you travel from major centres, the steeper it gets.
Why it matters for education: every school system assumption built in Brisbane or Canberra — online NAPLAN, digital enrolment, parent portals, BYOD programs — lands differently at each point on that slope.
2. Affordability is the sharpest divide of all — and it’s brutal
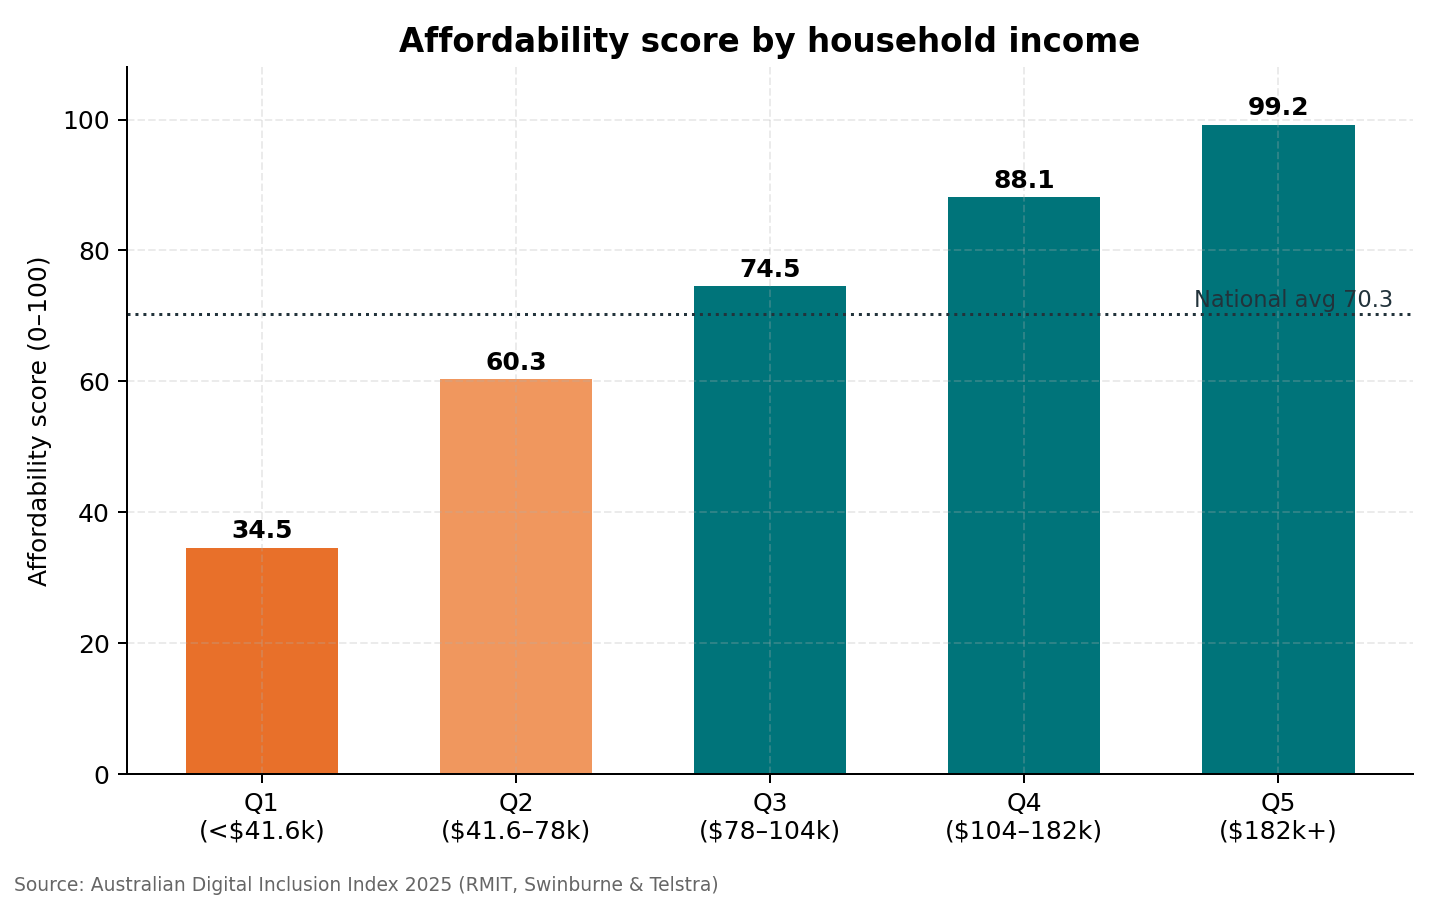
If there is one chart from this report that should stop people mid-scroll, it’s this one. Affordability isn’t a gentle gradient across income levels — it’s a cliff:
- Households in the highest income quintile score 99.2 — near the top of the measure.
- Households in the lowest income quintile (under $41,600/year) score 34.5.
That’s a 65-point gap on a 100-point scale, between people living in the same country, often in the same suburb.
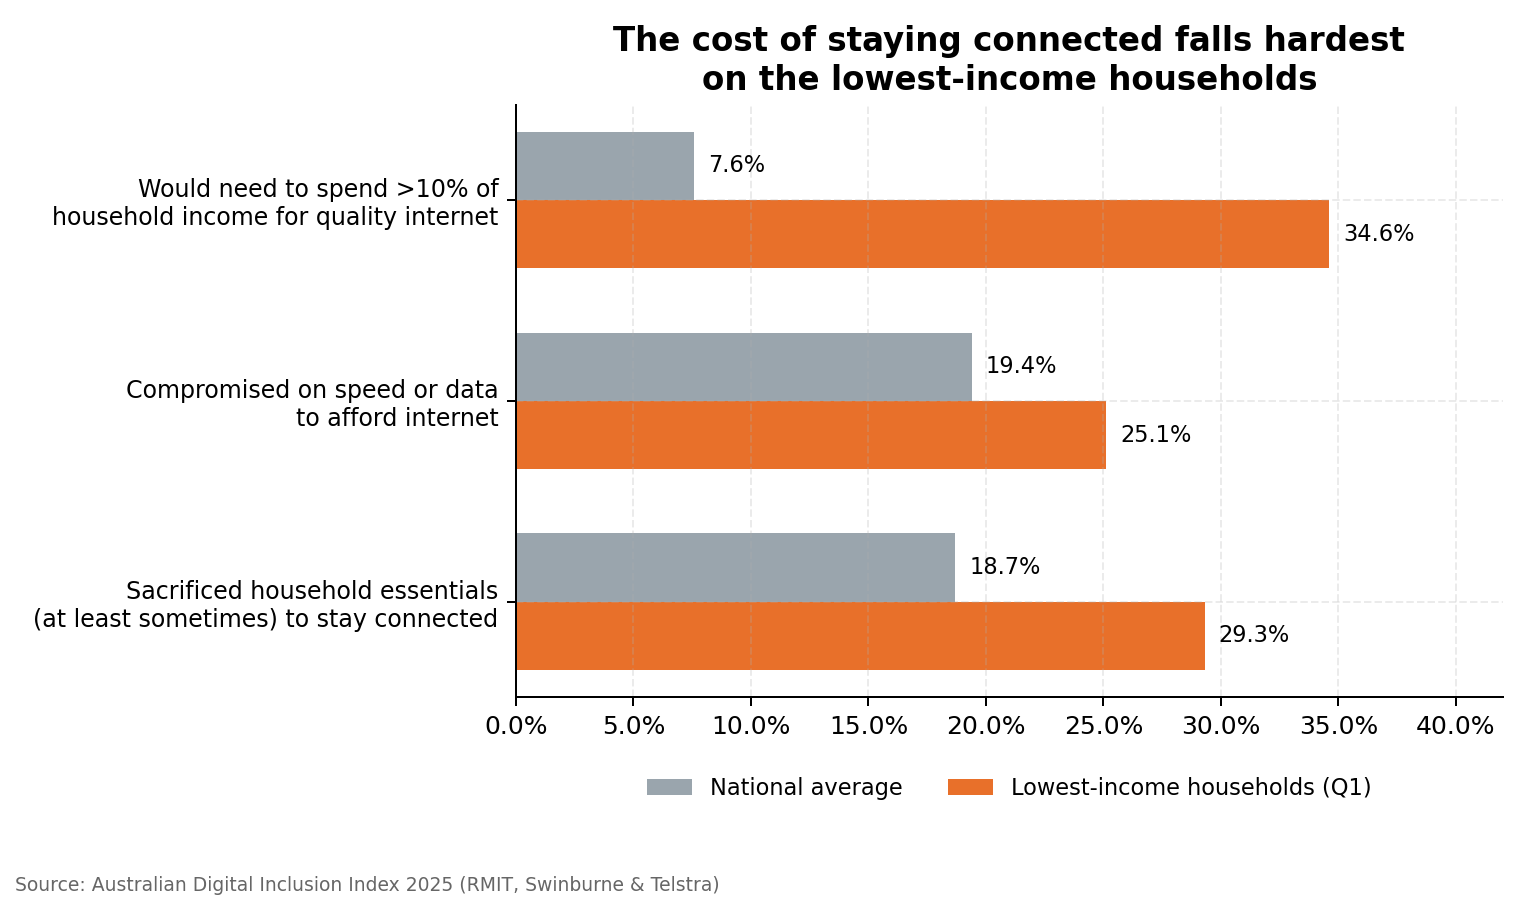
Dig one layer deeper and the human cost is visible:
- More than a third (34.6%) of the lowest-income households would need to spend over 10% of their household income to get a quality internet connection. For the top two quintiles, that figure is effectively zero.
- A quarter of low-income households have compromised on speed or data just to afford a connection at all — and nearly one in five Australians overall have done the same.
- Around 29% of the lowest-income households have sacrificed household essentials at least sometimes to stay connected. Read that again: food, power, fuel — traded off against the internet, because the internet is no longer optional. Centrelink is online. Banking is online. School communication is online.
The ADII’s affordability rankings read like a map of the communities public schools serve: public housing tenants (44.3), people receiving income support (53.7), people who didn’t complete secondary school (54.6), single parents (62.6). These aren’t edge cases in North Queensland classrooms. They’re our enrolment lists.
There is a useful policy lesson here, but not a current referral option. The federal School Student Broadband Initiative reached its allocation of 30,000 eligible families, and existing services will continue until 30 June 2028. However, the program is closed to new families. Schools, P&Cs and community organisations were essential to finding eligible households. The need did not disappear when the places ran out.
3. Age is the other great divide — and 75+ Australians are being left behind
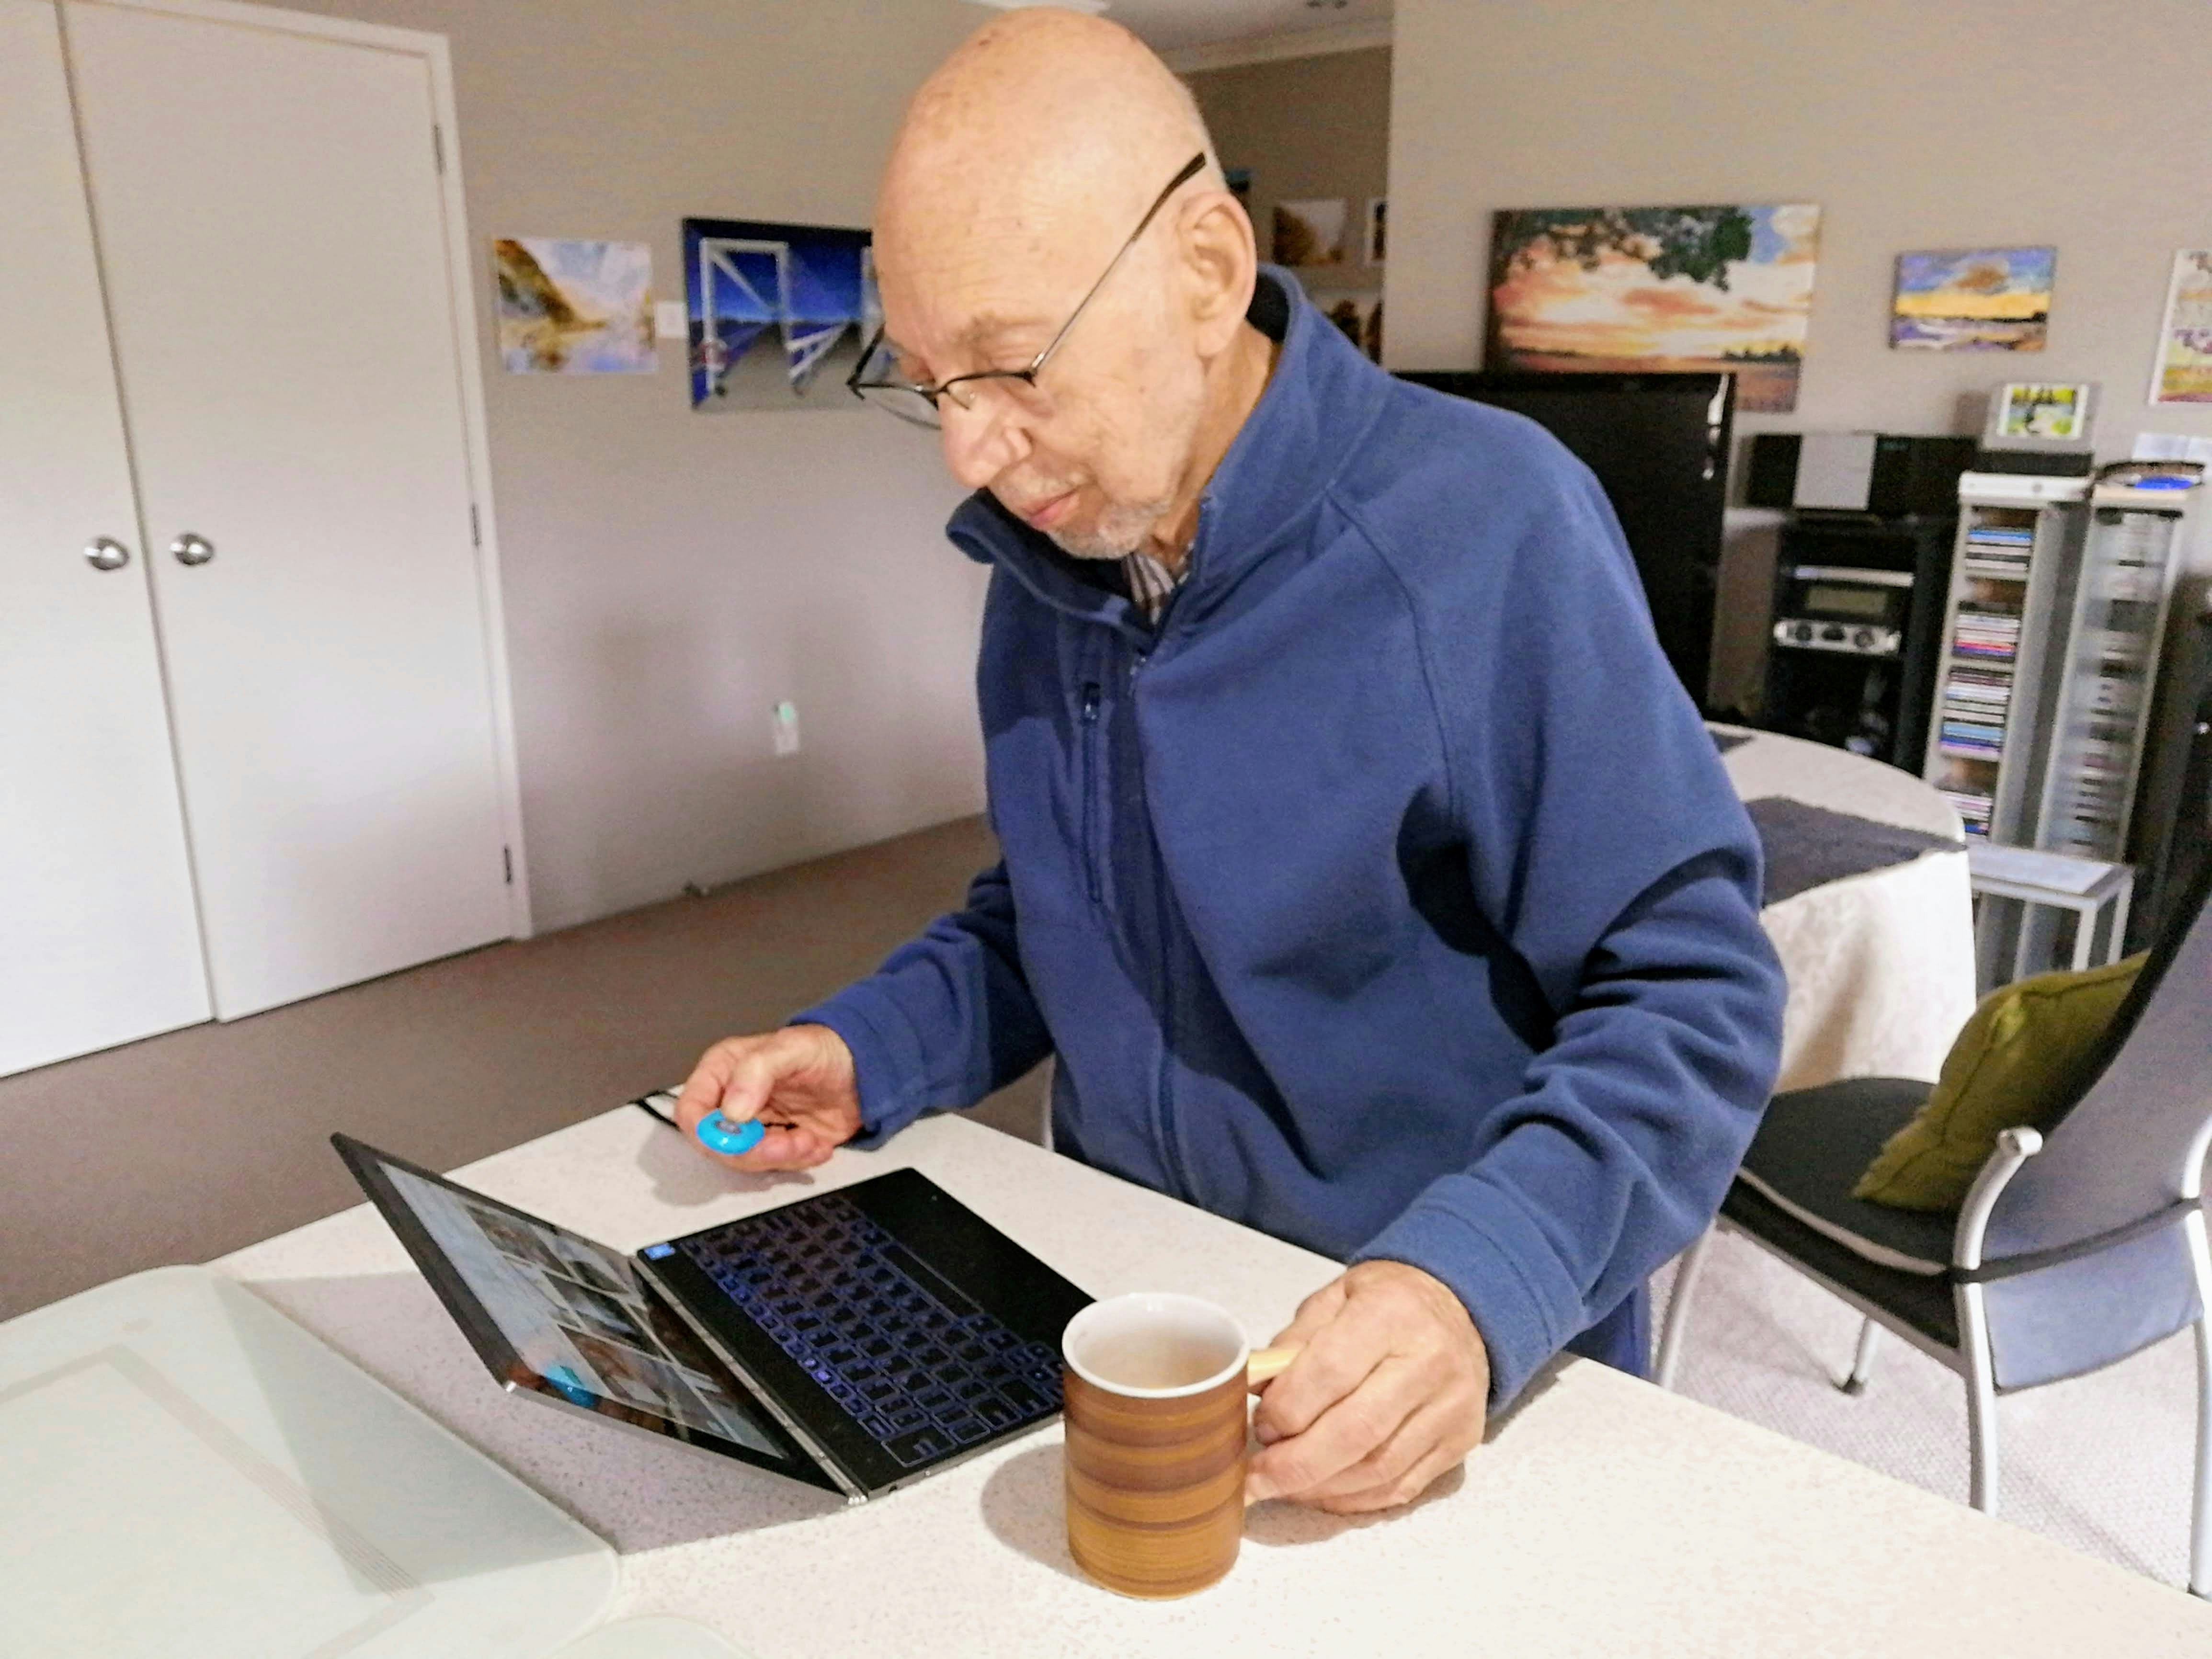
Photo by Den Lyons via Unsplash.
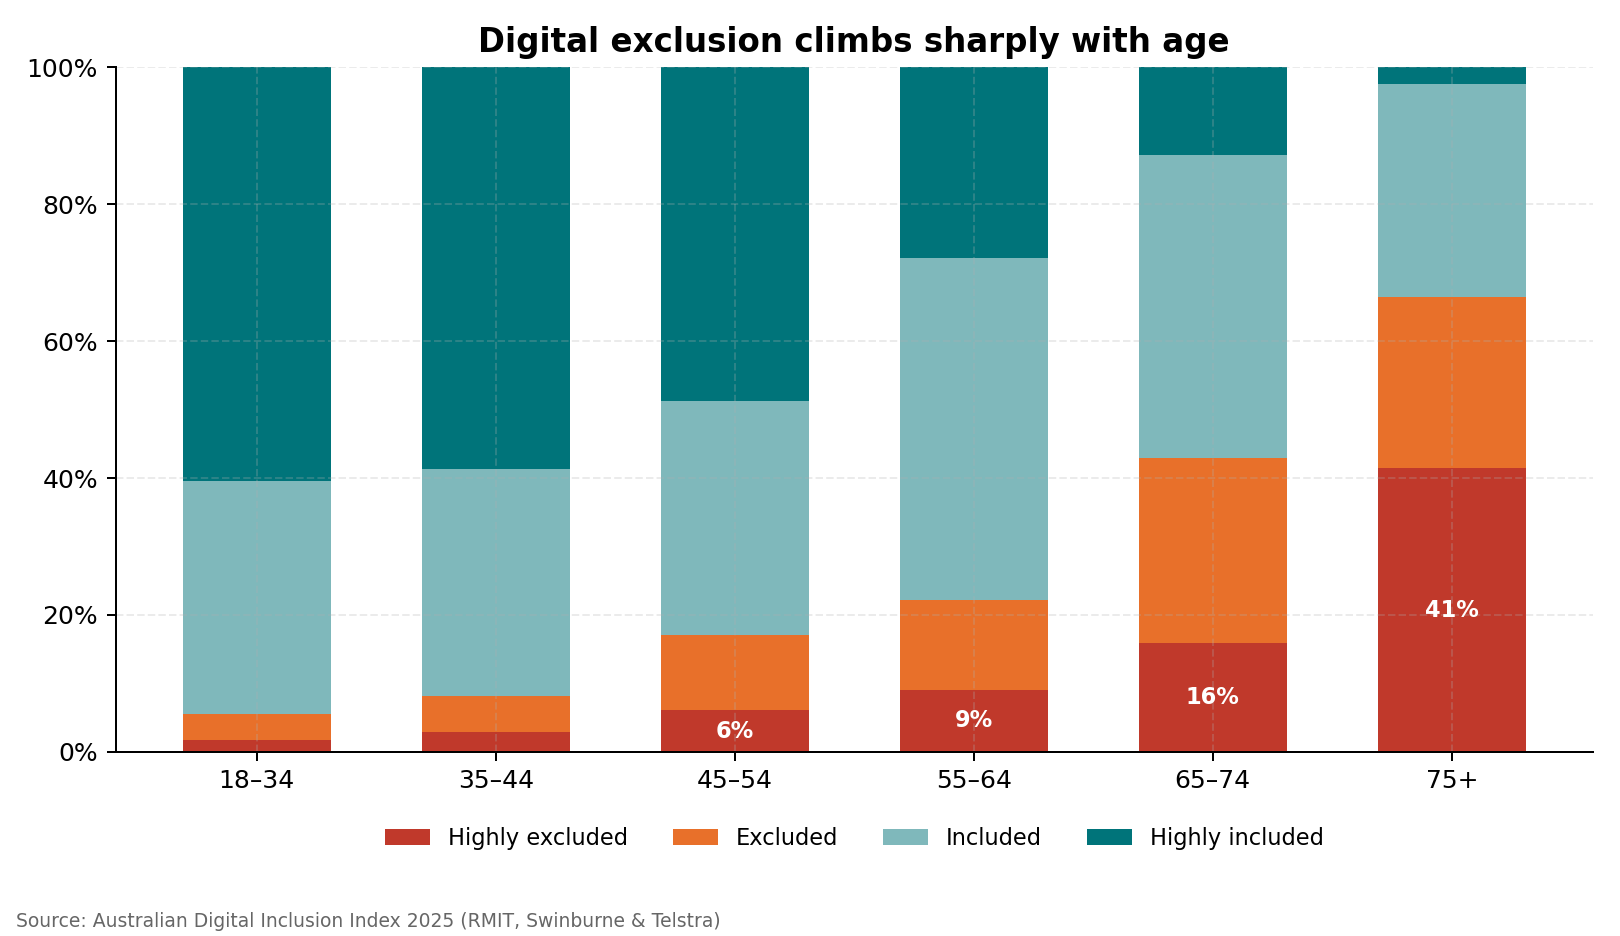
The generational numbers are confronting:
- 41% of Australians aged 75+ are “highly excluded” from digital life, and another 25% are “excluded.” That’s two in three older Australians locked out to some degree — at exactly the moment that MyGov, telehealth, banking and even parking meters assume a smartphone in every hand.
- By contrast, only about 2% of 18–34 year olds are highly excluded.
- On Digital Ability, the 75+ cohort scores 41.5 against 88.9 for 18–34 year olds — a 47-point chasm.
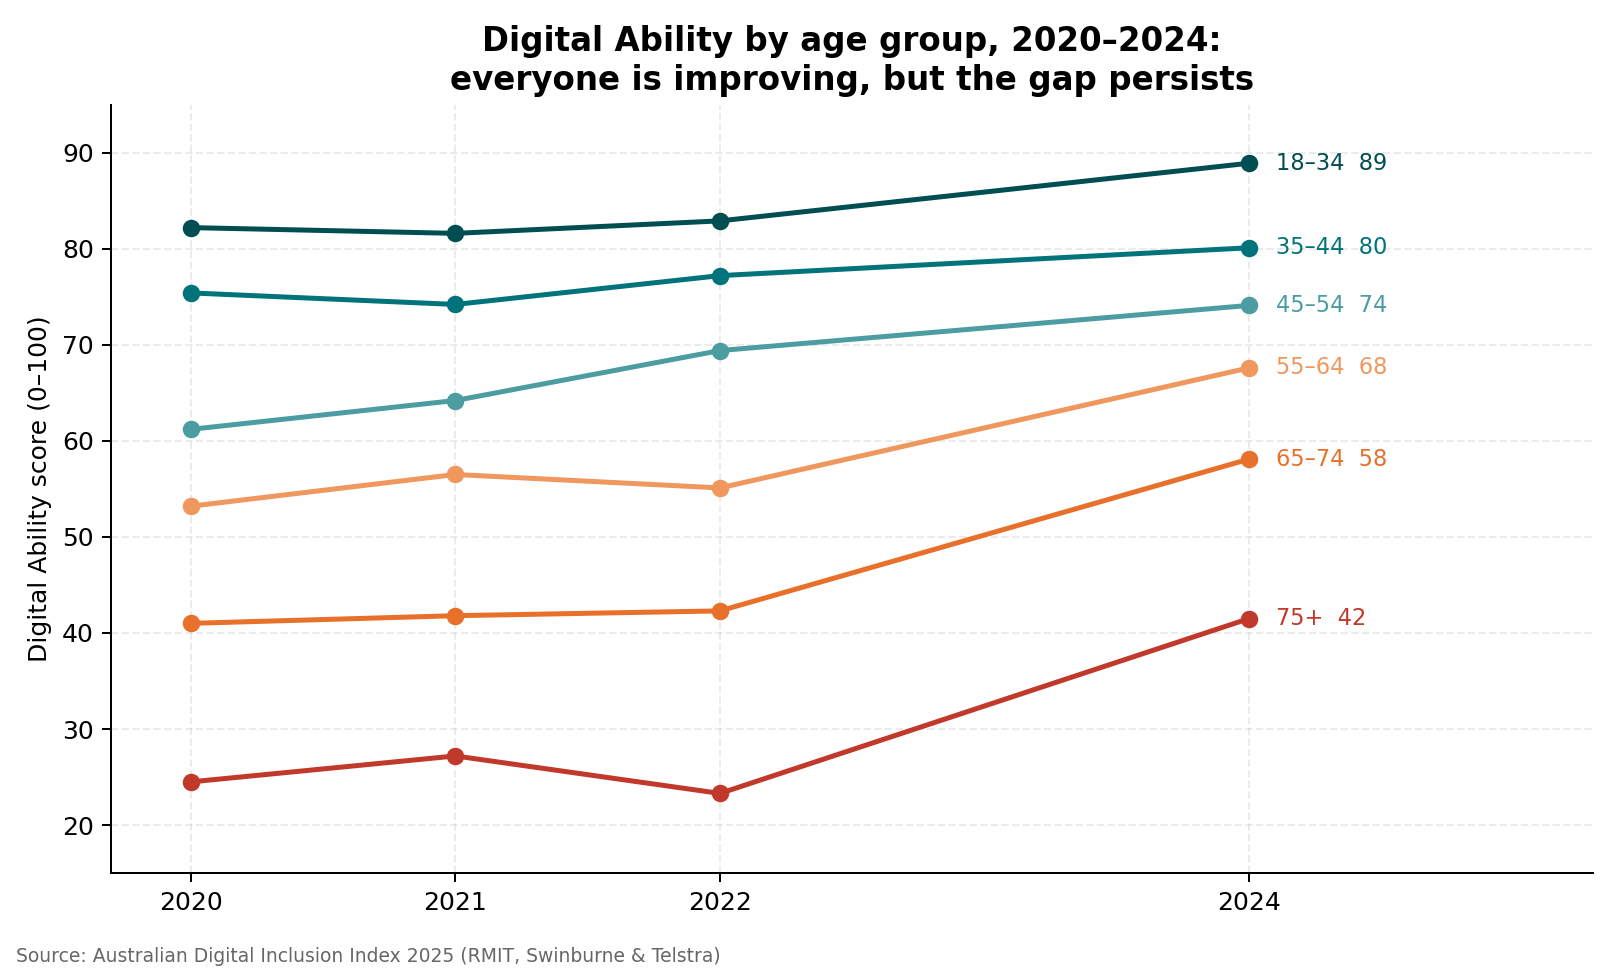
Here’s the genuinely hopeful part: every age group improved between 2022 and 2024, and the older cohorts improved fastest. The 65–74 group jumped from 42.3 to 58.1, and the 75+ group from 23.3 to 41.5. Older Australians are not incapable of digital life — they have had fewer opportunities and more barriers, and the numbers show that change is possible.
The barriers data backs this up. Among the 75+ group, the biggest reported barriers aren’t infrastructure — they’re concern about privacy and scams (24%), feeling the internet isn’t a priority (29%), and lack of confidence (13%). Those are human problems with human solutions: patient, trusted, face-to-face help.
This is where local initiatives shine. Programs like Youngster.co bring young people and seniors together for personalised tech-help sessions in everyday community spaces. Seniors get patient, judgment-free help with the things they actually need — banking apps, video calls, passwords and spotting scams. Young people gain paid or volunteer experience, real responsibility and intergenerational connection: the kind of authentic learning experience we struggle to manufacture in classrooms. Every shopping centre, library and council in North Queensland should be looking hard at this model, alongside the free digital-literacy help many local libraries already provide.
4. The mobile-only trap: why North Queensland’s connectivity is more fragile than the numbers suggest
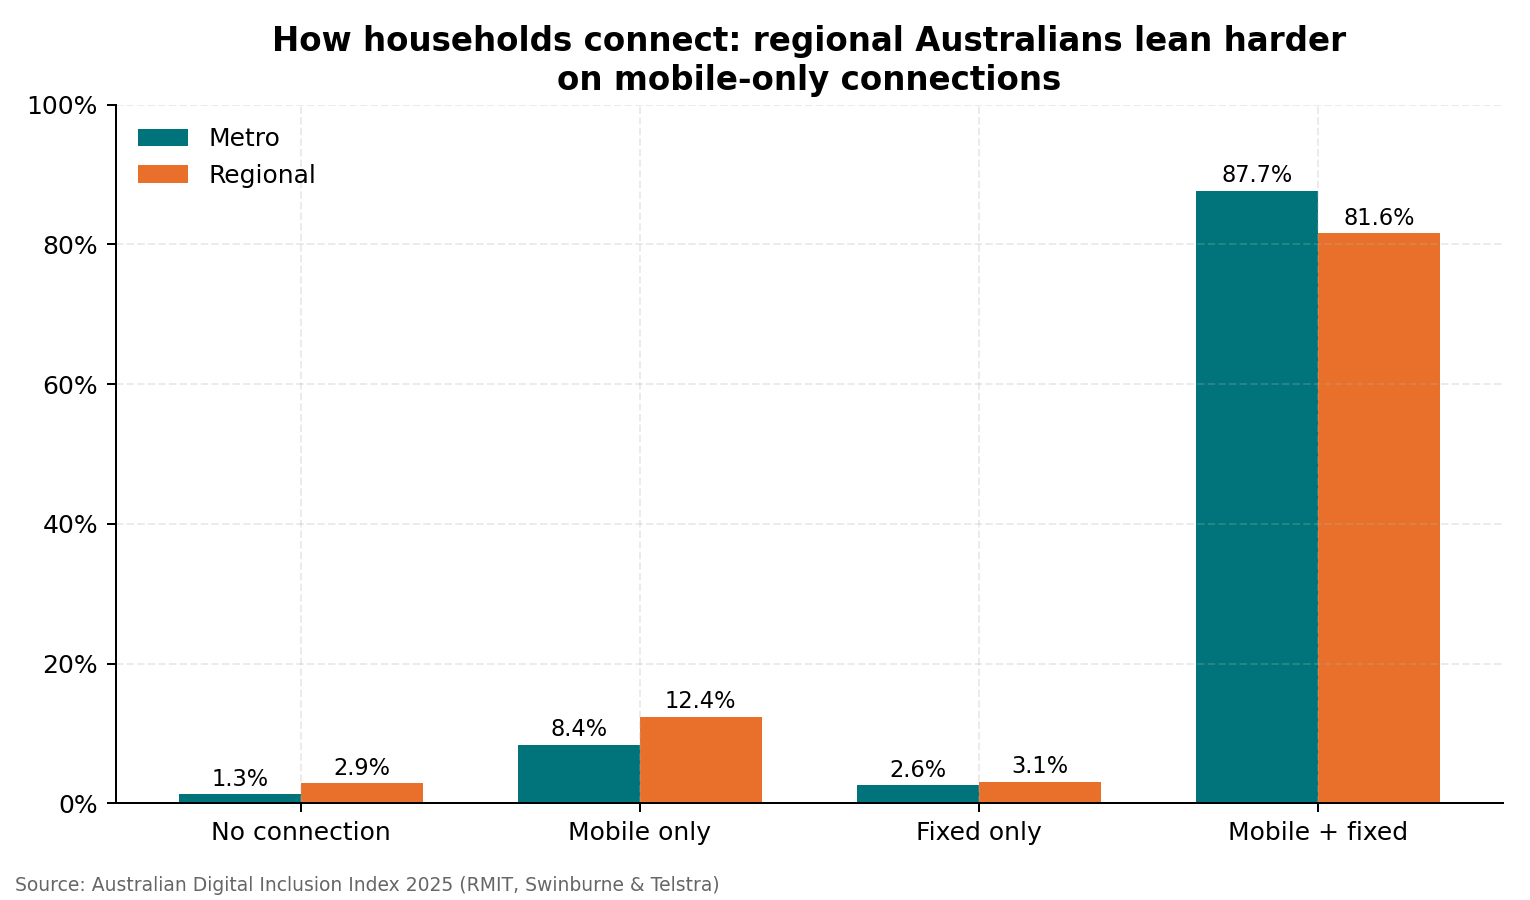
On the surface, regional access looks like it’s catching up — the regional Access score rose from 65.5 in 2020 to 73.8 in 2024. But look at how regional households connect:
- 12.4% of regional households are mobile-only (versus 8.4% metro).
- 2.9% of regional households have no connection at all — more than double the metro rate.
Mobile-only households have fewer options when something goes wrong, and North Queenslanders know exactly why. The 2019 Townsville monsoon, Cyclone Kirrily in January 2024 and the 2025 North Queensland floods all showed how quickly power, roads and communications can be disrupted. If a household’s only connection is mobile, tower outages, damaged backhaul, power failures or congestion can also cut access to disaster dashboards, emergency information, insurance claims, government payments and contact with family.
Mobile-only access can also mean tighter data limits and less capacity for a school term of video lessons, cloud submissions and other data-heavy work. A phone can be a lifeline without being an adequate substitute for a reliable home connection.
For a technical audience, the takeaways are practical:
- Resilience matters as much as speed. Battery backup at towers, community Wi-Fi hubs with independent power, and offline-capable services should be standard planning assumptions in cyclone country — and it’s worth asking your council and local MP where those investments sit.
- Evacuation centres, libraries and shopping centres that offer free public Wi-Fi and charging become critical infrastructure during disasters. Councils that have invested in free CBD and library Wi-Fi deserve credit for it — and should be encouraged to extend it to flood-prone suburbs and communities.
- If you build digital services for this region — school platforms included — design for intermittent, low-bandwidth, mobile-first use. Offline-first isn’t a nice-to-have here; it’s the difference between a service that works in the wet season and one that doesn’t.
5. The next divide is already forming: generative AI

Photo by Vitaly Gariev via Unsplash.
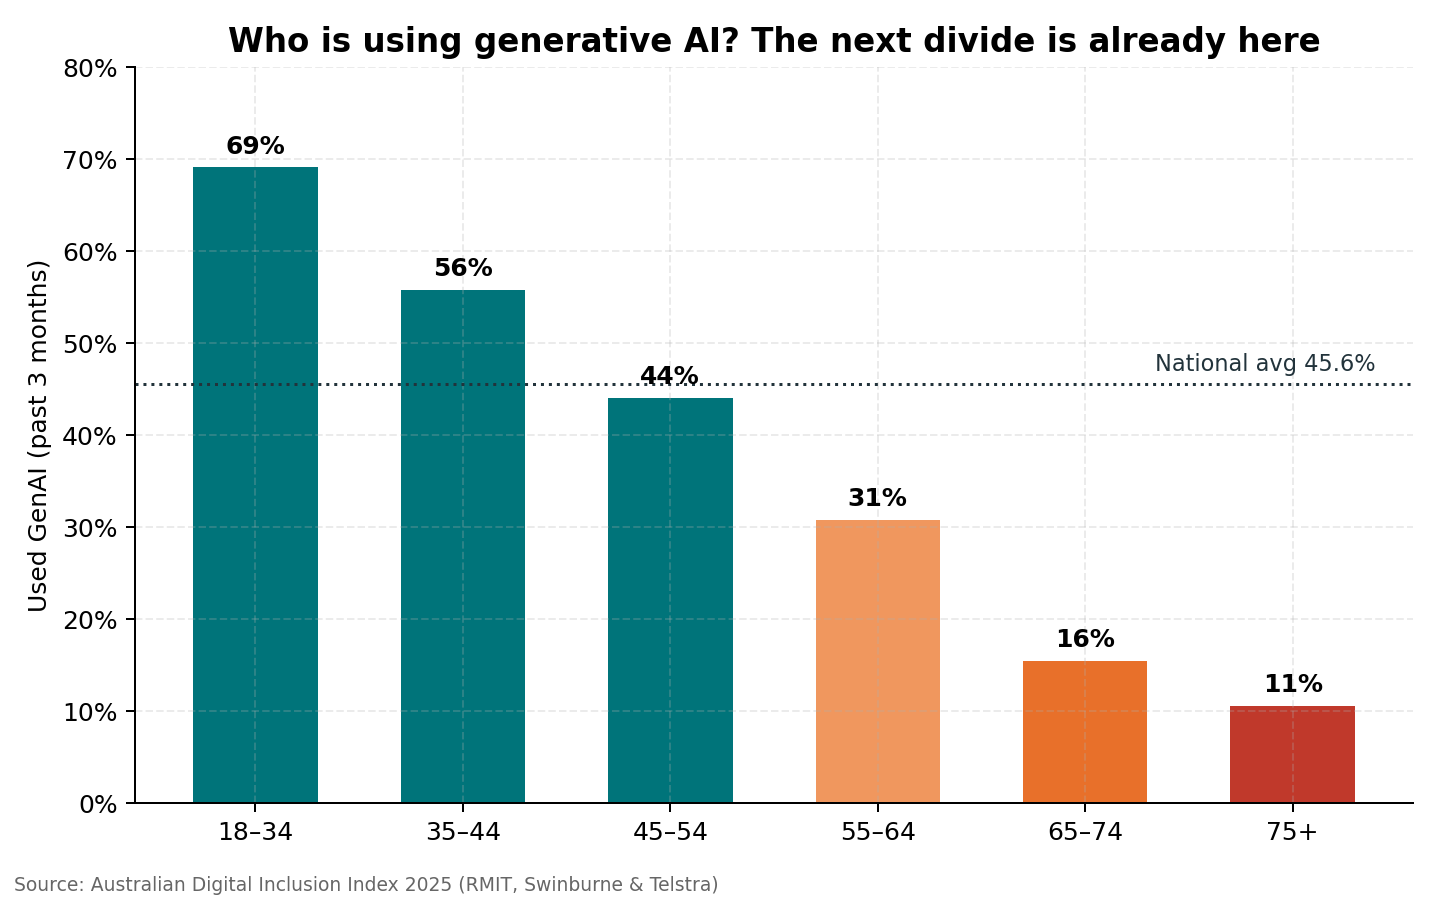
For the first time, the ADII measured generative AI use — and the pattern should feel familiar:
- 45.6% of Australians had used GenAI in the previous three months.
- 69% of 18–34 year olds had used it — versus 15.5% of 65–74s and 10.6% of the 75+ group.
- Uptake is also higher among students and people working in professional and managerial roles.
We are watching a new divide open, and some of the fault lines already look familiar: age, education and the kind of work people do. Access, affordability and digital skills will also shape who gets a chance to use these tools confidently. If we treat AI literacy the way we treated internet literacy in the 2000s — as something people will just pick up — we’ll spend the 2030s running catch-up programs.
For educators, there’s a sharper point: the students in our region who lack reliable, affordable connectivity today are the same students who will miss the AI-fluency window tomorrow. The divides compound.
What’s actually working — and what you can do
The genuinely encouraging story in the 2025 ADII is that the numbers can move. Access and Digital Ability both improved substantially in the latest wave, with the largest Digital Ability gains among older Australians and people who did not complete secondary school. That progress is a reason to invest in support, not a reason to assume the divide will take care of itself.
Locally, the building blocks are already here:
- Libraries remain the quiet heroes of digital inclusion — free Wi-Fi, public computers, printing, and staff who help without judgment. The ADII shows 12.5% of Australians (and 22% of young people) use the internet at public libraries. Fund them accordingly.
- Shopping centres and councils hosting intergenerational tech help turn everyday spaces into digital-inclusion infrastructure.
- Schools and community organisations remain trusted messengers. The School Student Broadband Initiative is closed to new families, but schools can still identify unmet need, help families contact provider hardship teams and make the scale of that need visible to decision-makers.
- Your retail telecommunications provider remains the first point of contact for account enquiries, faults, plan changes, billing and service options — even where the underlying network is supplied by a wholesaler. If a complaint remains unresolved, the Telecommunications Industry Ombudsman provides independent dispute resolution.
If you’re reading this and you work in tech, education or community in North Queensland, here’s my short list:
- Ask one family what is getting in the way. Cost, coverage, a suitable device and confidence need different solutions. Help them reach their provider’s hardship team, a local library or an appropriate support service.
- Ask your council what its disaster-resilient connectivity plan looks like — free Wi-Fi and charging at evacuation and recovery hubs should be non-negotiable.
- Volunteer an hour at a library or seniors’ tech session — or point a patient young person you know towards an intergenerational tech-help program.
- Build offline-first. If your app, portal or school platform falls over on a congested 4G connection in the wet season, it doesn’t work in North Queensland.
- Start talking about AI literacy now — in staff rooms, in U3A groups, in community centres — before this divide sets like concrete.
The digital divide isn’t only a technology problem waiting on better infrastructure. It is also a community problem, and the data shows that change is possible. North Queensland has weathered floods, cyclones and everything in between by looking after each other. Digital inclusion is just the newest version of that same old job.
Download the underlying data
The charts in this article were prepared from the 2024 ADII dashboard exports published with the 2025 report. Download all seven XLSX data exports as a single ZIP archive.
Related perspectives
Two shorter companion articles explore practical parts of the same story:
- From e-waste to access: giving useful technology a second life looks at secure device reuse, community re-housing and responsible recycling.
- Before you donate that laptop: the security step digital inclusion depends on explains why data sanitisation, account removal and verification belong in every device-donation process.
The ADII analysis and downloadable source-data archive remain here; the companion articles link back to this post and the original Index findings rather than republishing the data files.
Data source: Thomas, J., McCosker, A., Parkinson, S., Hegarty, K., Featherstone, D., Kennedy, J., Ormond-Parker, L., Morrison, K., Rea, H., & Ganley, L. (2025). Measuring Australia’s Digital Divide: 2025 Australian Digital Inclusion Index. ARC Centre of Excellence for Automated Decision-Making and Society, RMIT University, Swinburne University of Technology, and Telstra. Charts were created from ADII dashboard data; figures are weighted to the Australian population. ADII data and these chart adaptations are licensed under CC BY-NC-SA 4.0.